
I am inspired by the intersection of science and art. For this project, I wanted to explore the visual representation of time, temperature and daylight. I started recording the high temperature, the low temperature, sunrise and sunset, on the Winter Solstice of December 2022. I recorded the information on graph paper with a graphite pencil and acrylic gouache. The painting is 12in x 48in.
I created the palette with 18 colors, each representing a 5 degree temperature range. For example : 65*-69* is Olive Green, 70*-74* is Mustard, 75*-79* is Yellow Ochre.
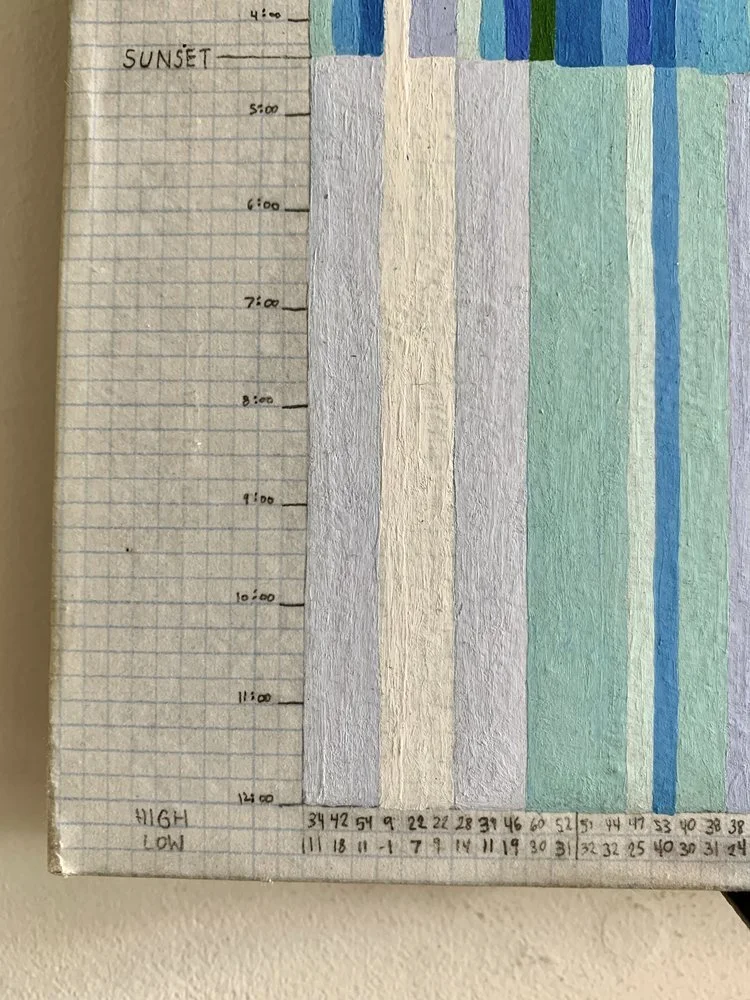
Each day is represented by one column. The column represents the hours in the day. The top of the column is 12:00am, the bottom of the column is 11:59pm. The high temperature is recorded from the time of sunrise to sunset, creating a band in the center of the column to represent the amount of daylight hours. The low temperature of the day is represented above and below the high temperature.
Because this painting was started on the day with the least amount of daylight hours, the band is small. Throughout the Spring, the band widens, as do the daylight hours. You can also see the shift in sunrise/sunset times when we adjust the clocks twice a year.